Reconstruct the atmospheric conditions your assets experienced to distinguish weather-related production losses from genuine underperformance, identify the root cause and take informed action.
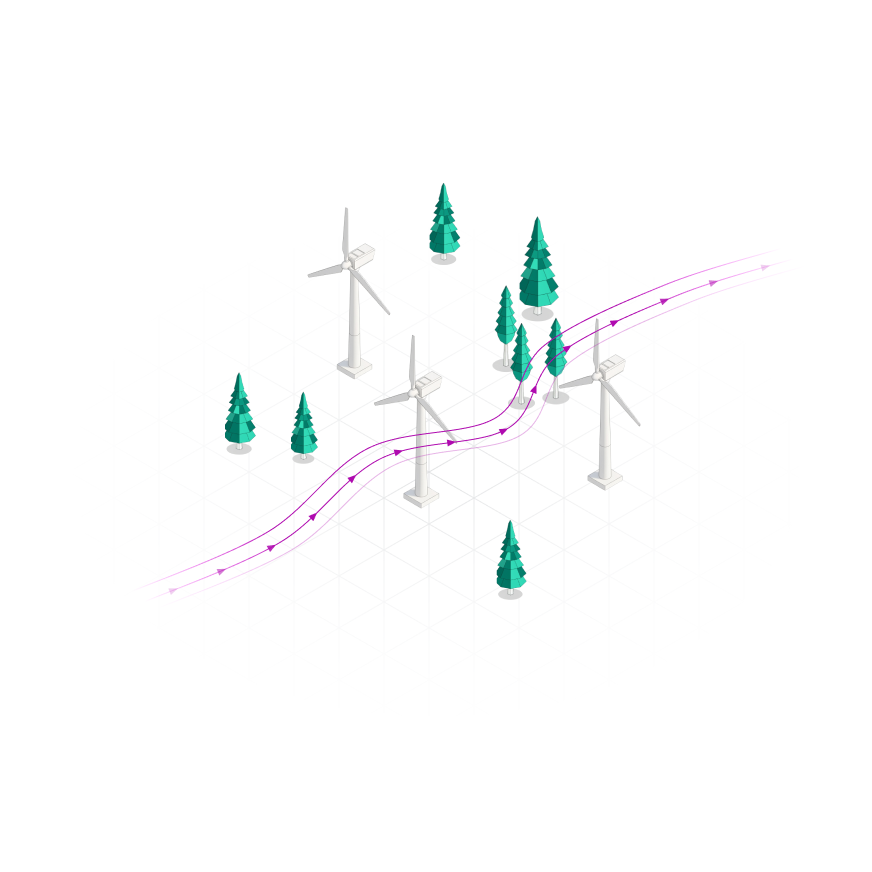
When generation falls below expectations, changing wind conditions, wakes, curtailment, downtime and turbine performance can all contribute.
SCADA shows that production dropped, but nacelle wind readings are distorted by the rotor itself. Without a reliable picture of the conditions an asset experienced, weather-driven losses and genuine underperformance look the same.
Getting it wrong sends crews to the wrong turbines, triggers unnecessary interventions and distorts the numbers behind performance guarantees and asset valuations.
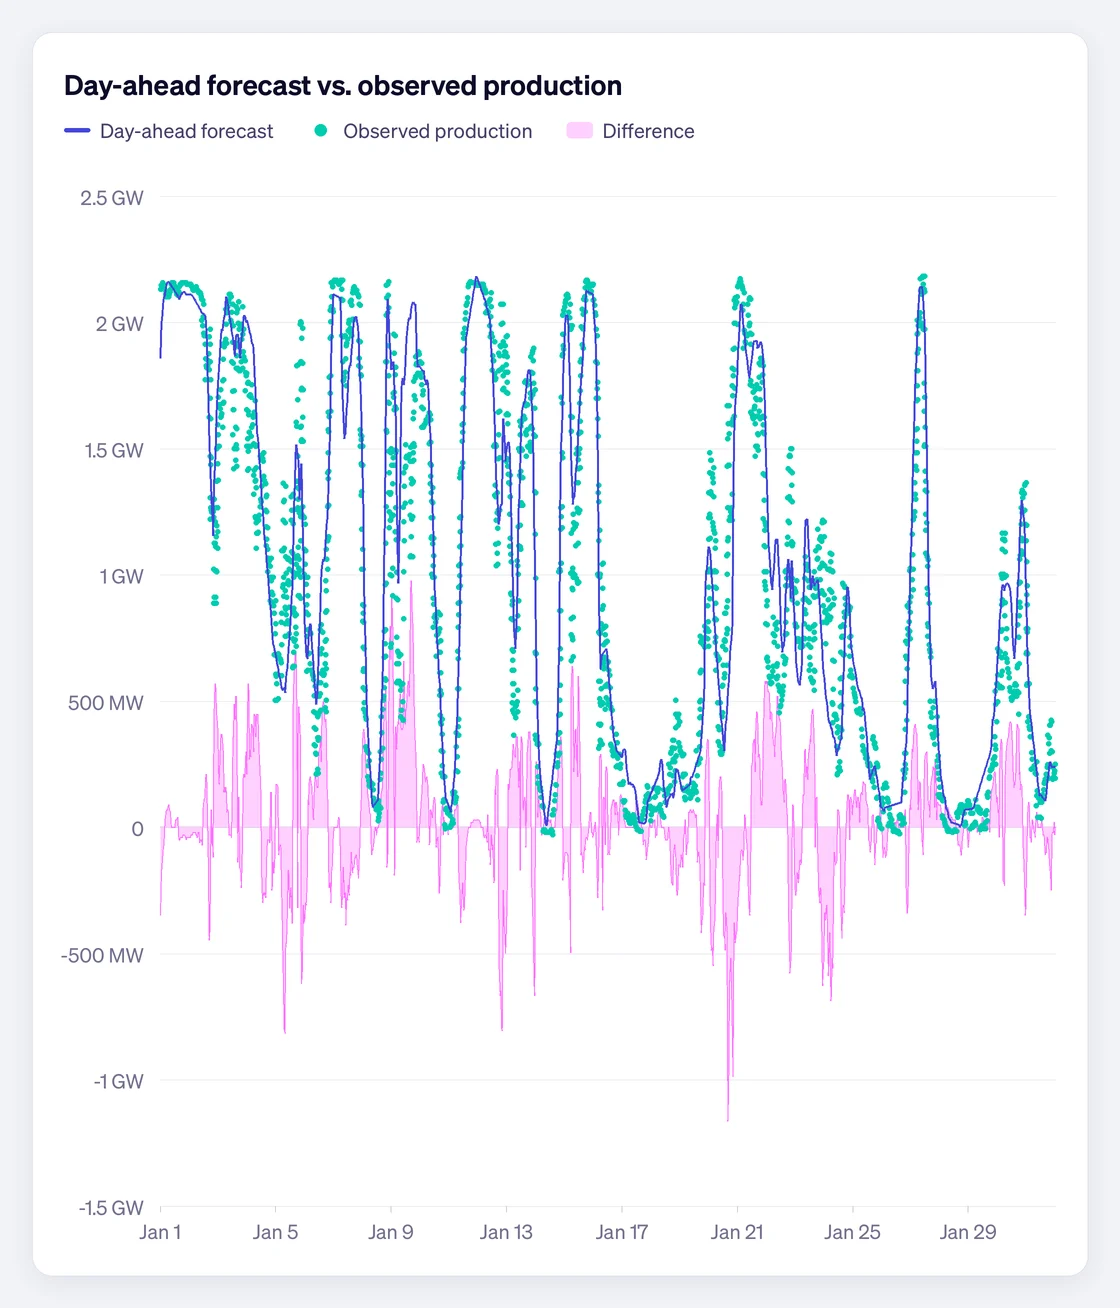
Compare actual production with expected generation to identify deviations and investigate the conditions behind them.
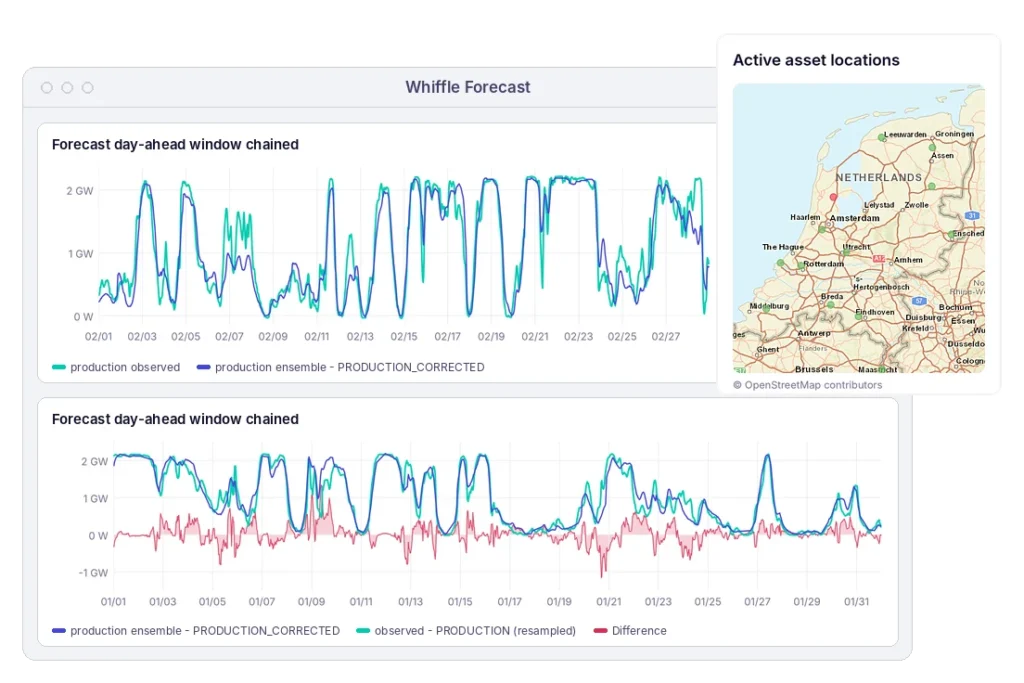
Compare expected and actual generation over time to identify emerging or persistent performance deviations across individual assets or portfolios.
Reconstruct historical wind and flow conditions to investigate whether production shortfalls are consistent with the weather and wake effects an asset experienced, or whether other causes warrant closer examination.
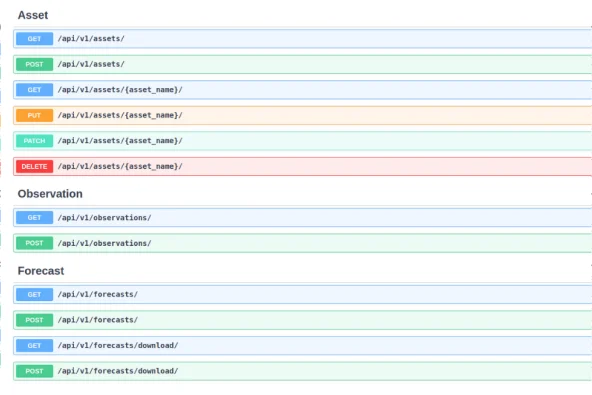
Expected wind and solar generation forecasts for ongoing comparison with actual production, helping asset teams identify performance deviations as they emerge.
Historical wind and flow simulations to support post-construction performance assessments, wake analysis and investigations into past production shortfalls.
Our scientists investigate specific shortfalls, wake disputes and post-construction questions with you.
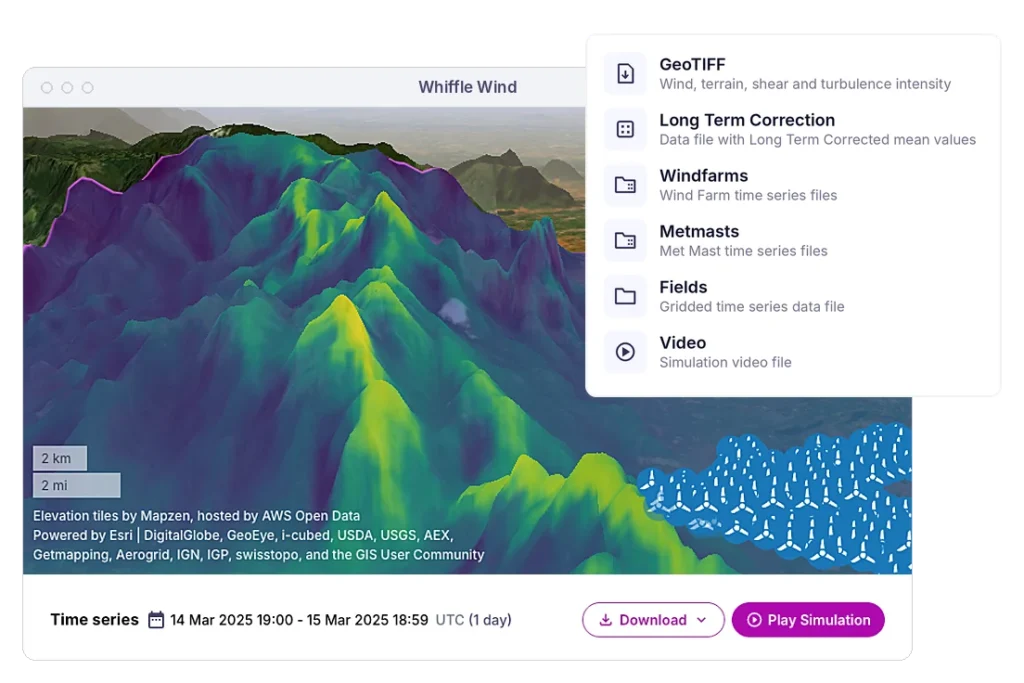
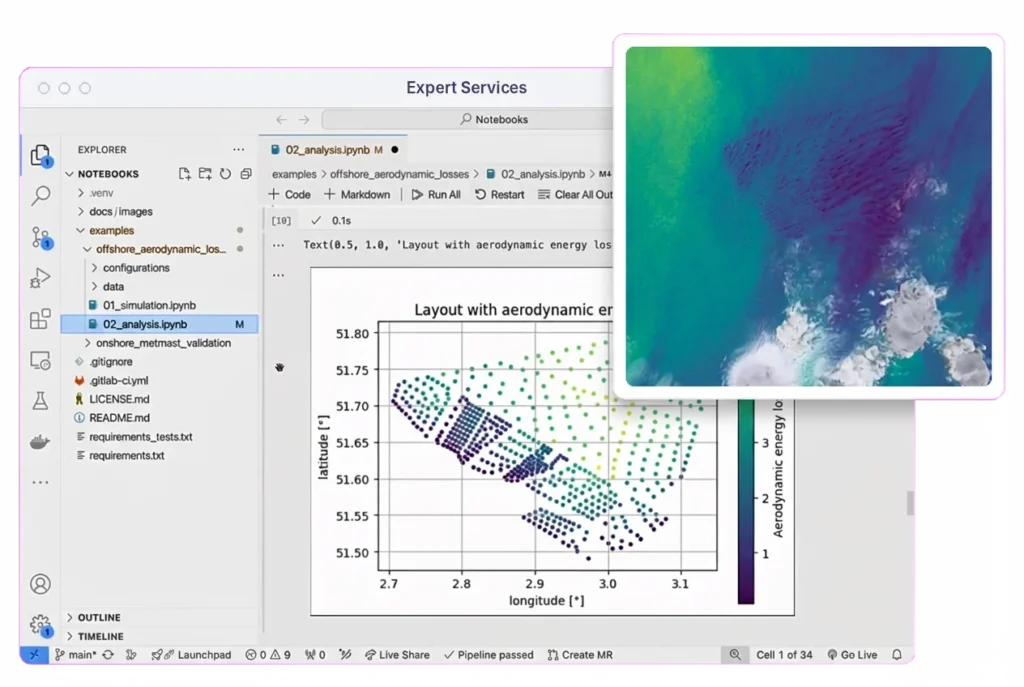
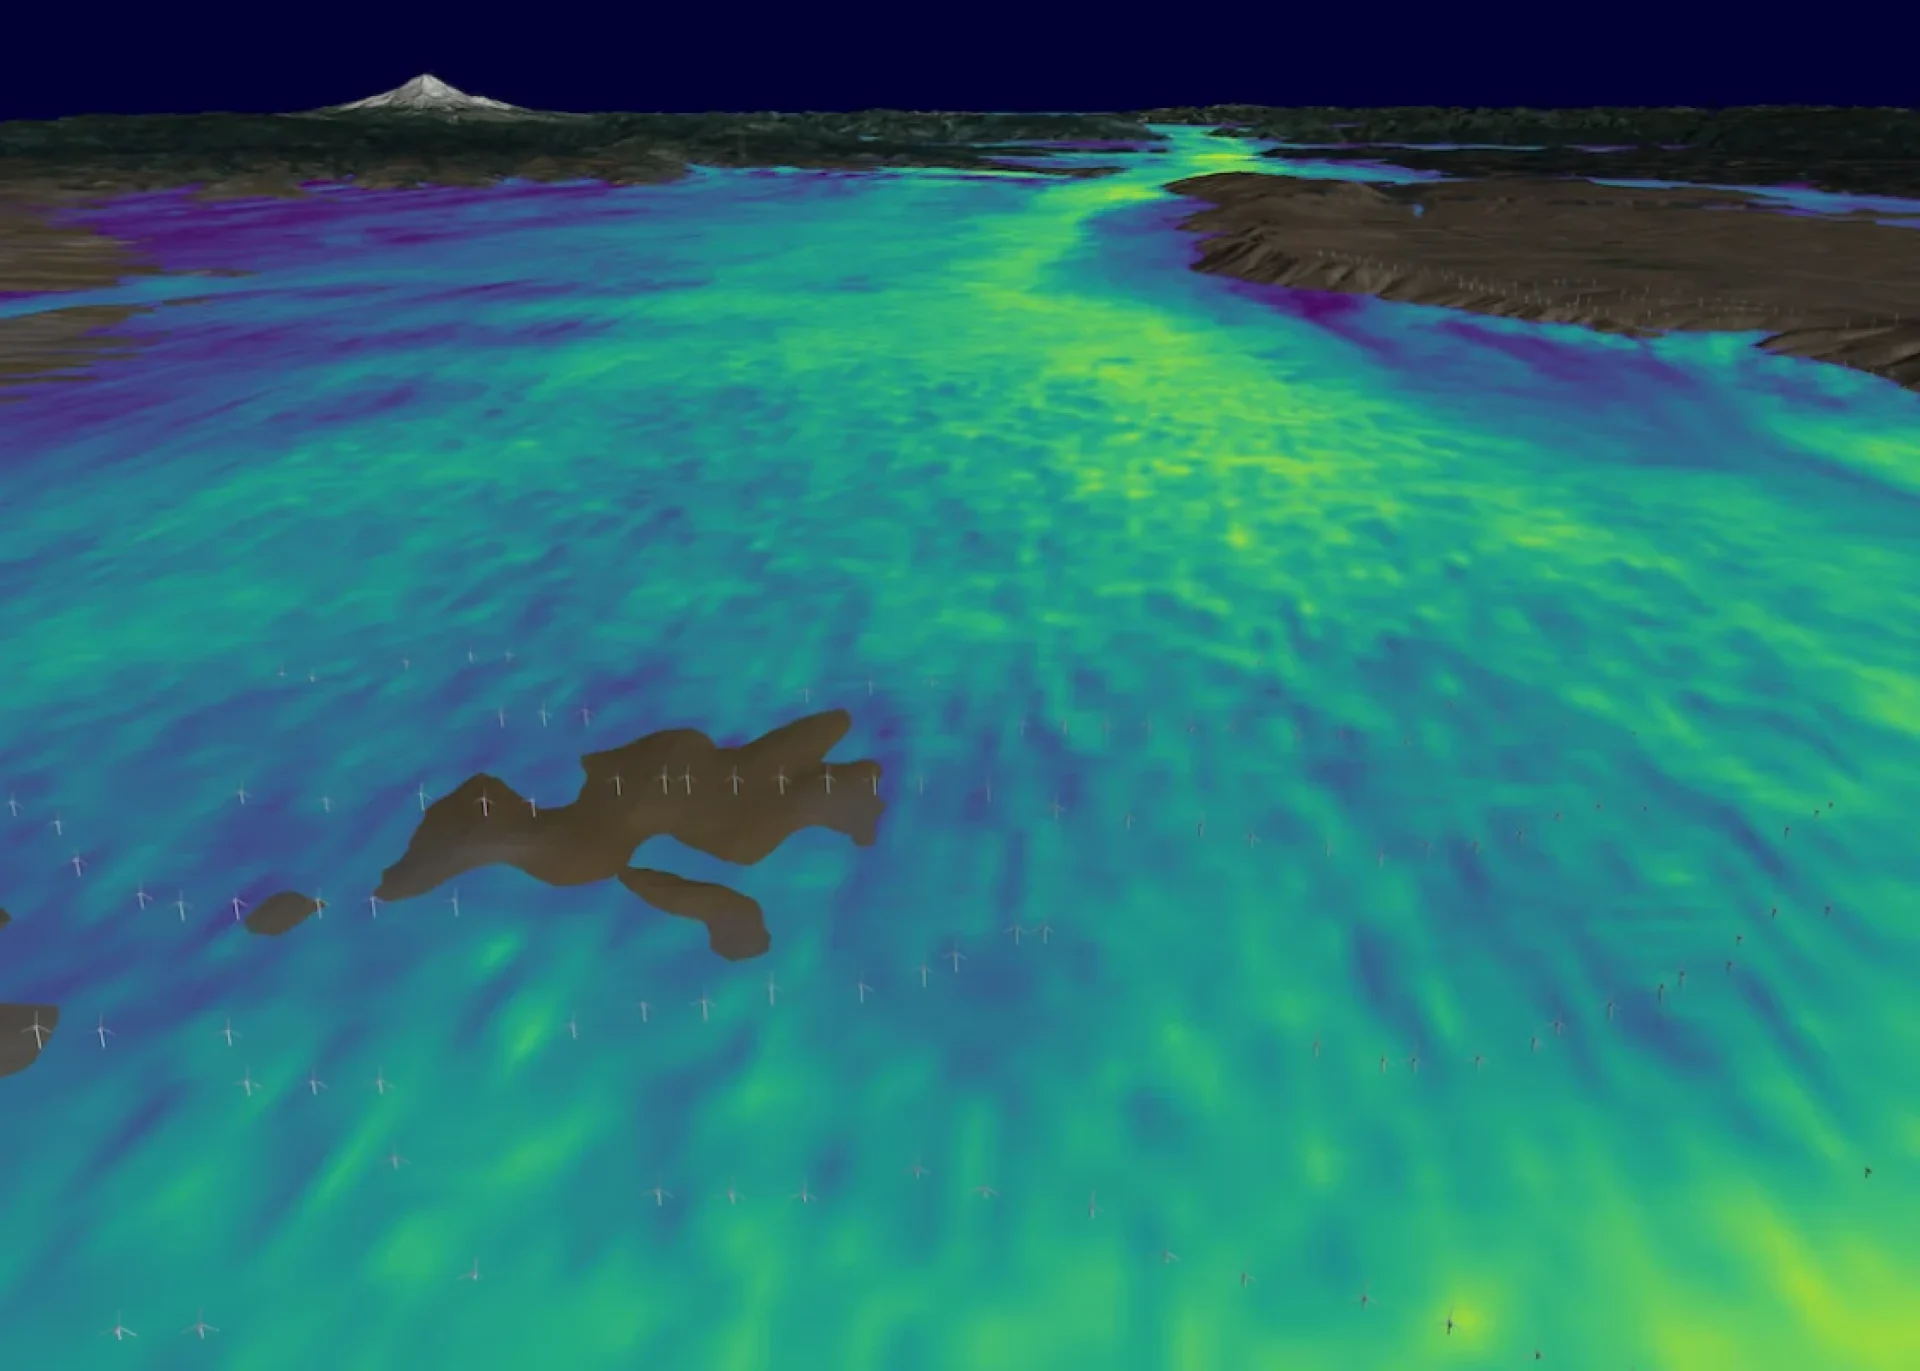
Whiffle combines real-weather modeling with high-resolution Large-Eddy Simulation (LES) to capture the local wind and wake conditions that influence generation across operating wind farms. This provides an independent reference for assessing performance and investigating production shortfalls.

Capture variations in wind speed, direction and turbulence across a wind farm, including local effects that regional weather models may miss.

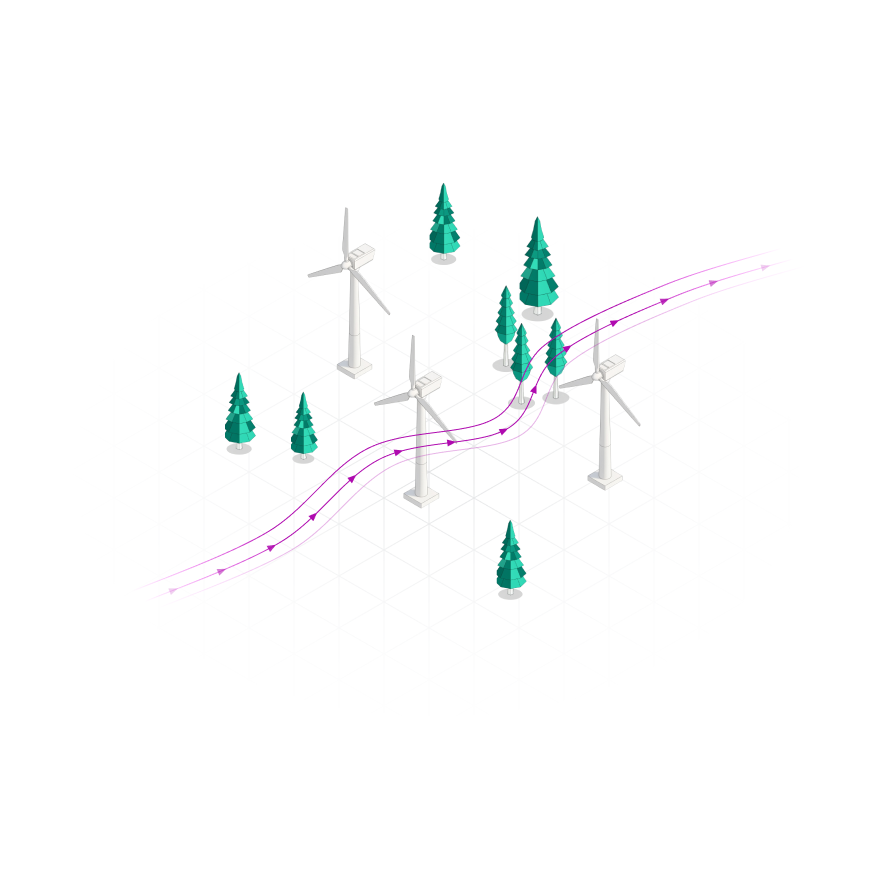
Simulate how atmospheric stability, terrain and neighboring wind farms influence the wind available to turbines, including wake interactions that conventional models approximate.

Compare modeled conditions and expected generation with actual production and SCADA data to investigate deviations and identify where further operational analysis is needed.
Whiffle's modeling has been tested against operational wind farm data, assessing how accurately it represents power production and the complex wake interactions that influence it.
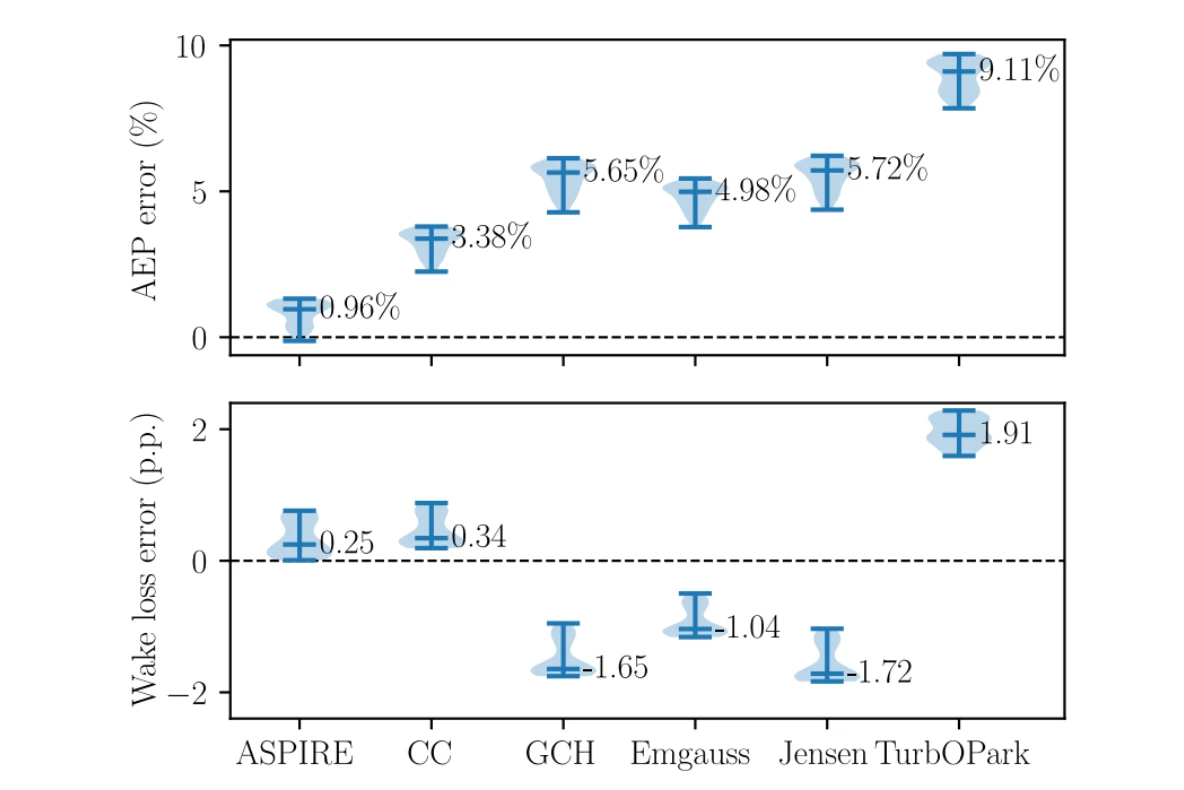

At the 69-turbine Hollandse Kust Noord wind farm, Whiffle LES was benchmarked against two years of SCADA data. It achieved 0.96% AEP error, compared with 3.38% for the best-performing conventional wake model tested.
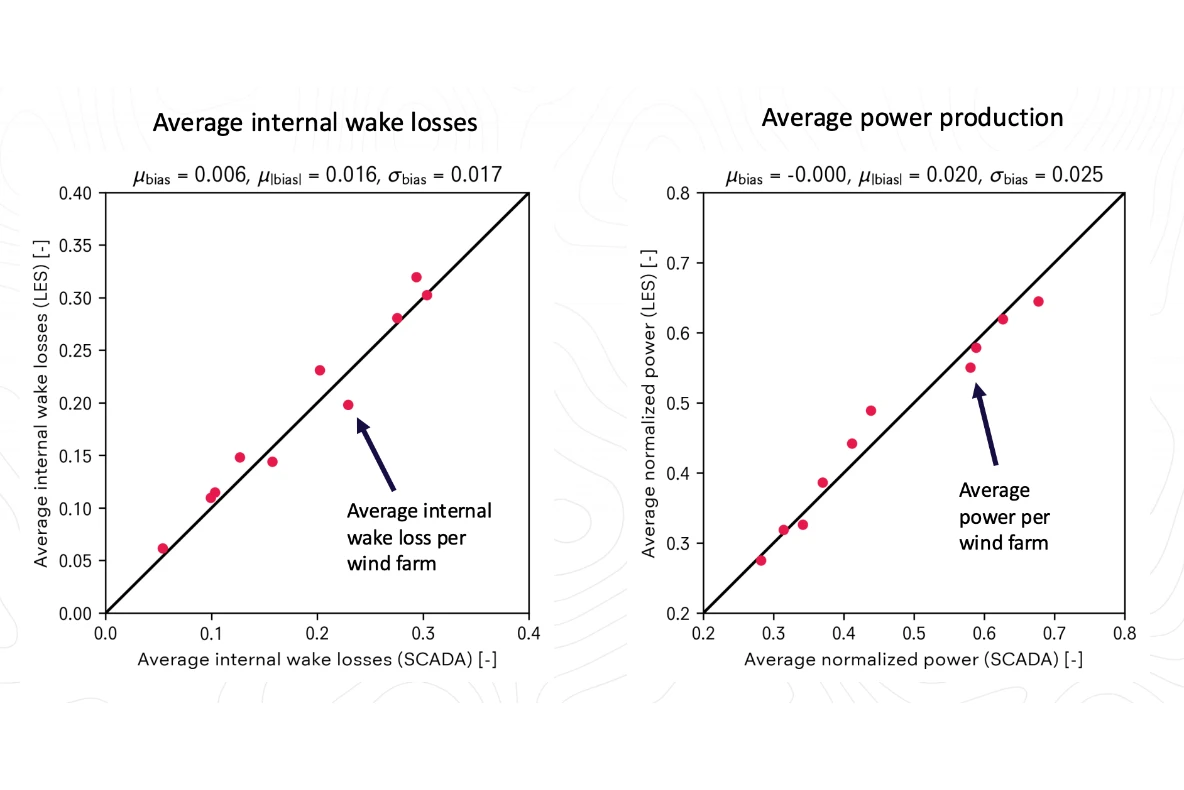
Across 10 operational wind farms, Whiffle LES captured how internal wake losses shift with the weather, from 20 to 40% on average to extremes near 60%.
Atmospheric simulation can be compared with production and operational data to assess whether a deviation is consistent with the conditions the asset experienced or warrants further investigation as an operational issue.
Yes. LES represents turbine and wind-farm wake interactions, helping assess whether observed production deviations are consistent with changing wake conditions, including effects from neighboring wind farms.
For post-construction analysis, simulated conditions and expected production can be cross-checked against SCADA data to investigate differences between expected and realized performance.
Monitoring identifies deviations over time. Underperformance investigation goes deeper into a specific shortfall, using atmospheric simulation and operational data to examine potential contributing factors.
Bring us an asset, operating period or performance question and explore how site-specific atmospheric modeling can add context to the investigation.
Meter-scale weather simulation for the sectors where weather drives decisions.
Peer-reviewed papers and technical reports
Articles and perspectives from our team
Conferences, webinars and on-demand recordings
Technical guides for the Whiffle platform
Get help from our team
Atmospheric science and Whiffle news in your inbox
Explore simulations from wind farms to city streets