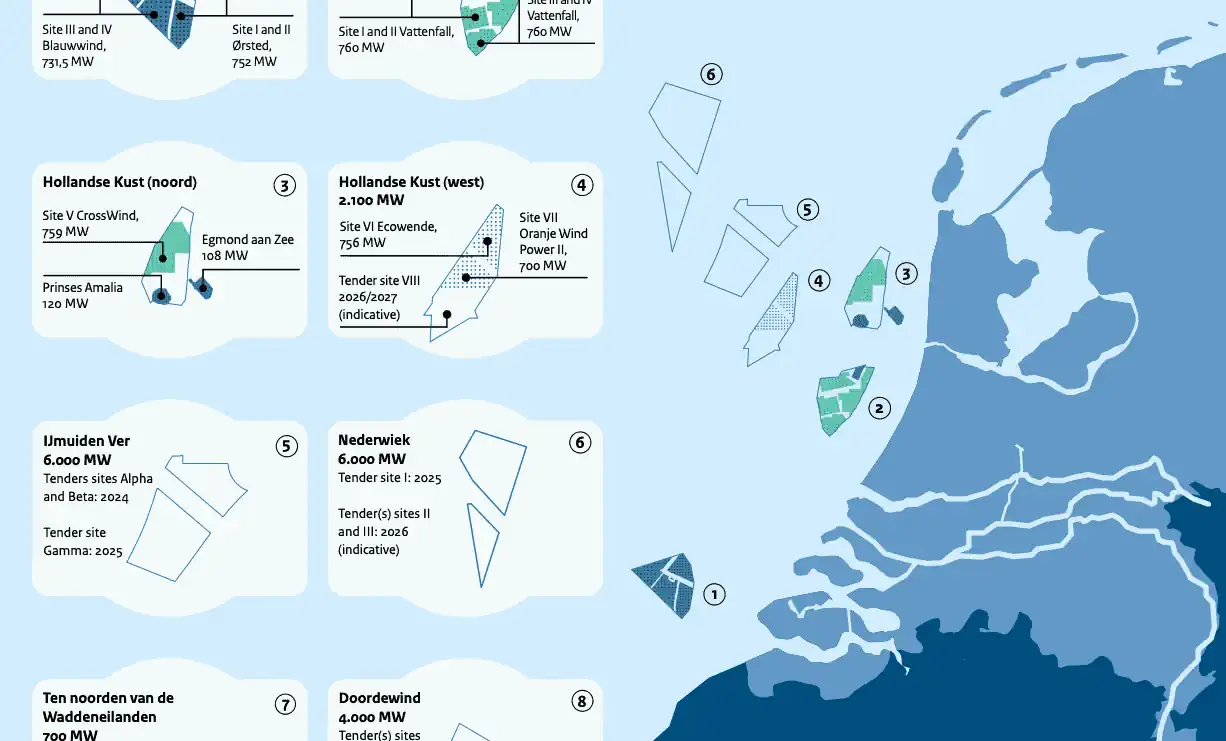
The IJmuiden Ver wind farm zone exemplifies the Netherlands’ commitment to decarbonization by integrating offshore wind into its energy system. With a total capacity of approximately 6 GW and positioned roughly 80 km from the shore, this ambitious venture represents the nation’s largest planned wind farm, covering a staggering extent of around 650 km².
Within this expansive zone, three distinct sites have been designated: Alpha (formerly I-II), Beta (formerly III-IV), and Gamma (formerly V-VI). The Dutch government is poised to kickstart two tender procedures for project permits, with Alpha and Beta scheduled to open for 2024 and Gamma set for 2025.
Amidst the industry’s focus on the ongoing tender process, a recent WES journal publication, “Investigating energy production and wake losses of multi-gigawatt offshore wind farms with atmospheric large-eddy simulation”, sheds light on the complexities of energy production in offshore multi-gigawatt wind farms. Authored by Peter Baas, Remco Verzijlbergh, Pim van Dorp, and Harm Jonker, this study employs Whiffle’s Large Eddy Simulation (LES)-based weather model.
Replicating an entire year of real weather conditions to investigate offshore wind farm performance.
Compared to other LES studies that have mostly considered a set of idealized case studies, this research utilizes the Whiffle LES model to replicate an entire year of real weather conditions. The study explores a a range of hypothetical scenarios, each characterized by variations in turbine type, installed capacity density, and layout for 4 GW offshore wind farms. One of these scenarios is tailored to the unique context of the IJmuiden Ver wind farm zone.
However, only considering the IJmuiden Ver wind farm zone in isolation is likely misleading. Other large wind farms will soon be built at relatively short distances, impacting power production due to wakes from upstream wind farms. This is illustrated in the above animation, simulated by Whiffle’s LES model. It shows the evolution of the wind speed around hub height over the IJmuiden Ver area for a particular day.
Evidently, downstream of the wind farms, the wind speed is reduced for tens of kilometers. The combined effect of clusters of wind farms will be an increasingly urgent topic in the industry and its importance goes beyond the North Sea alone: a similar clustering of wind farms is occurring off the coast of North America and in the Baltic Sea as well.
Next up: Wake losses
So, what are the wake losses you can anticipate for a wind farm of the size of IJmuiden Ver? How does atmospheric stability influence wind farm energy production? What role do blockage effects play in shaping energy production and wake losses? Don’t miss the first blog of the series, exploring wake losses in multi-gigawatt wind farms.
Leverage LES to optimize wind farm design and planning
Baas et al.’s research harnesses a high-fidelity, wind modelling technique rooted in Large Eddy Simulation (LES). With our newest solution, Whiffle Wind, we’ve now made it possible for anyone to harness LES-powered weather modelling technology – regardless of your technical background. Curious? Visit: https://whiffle.nl/get-free-trial/ and we’ll get you started right away.