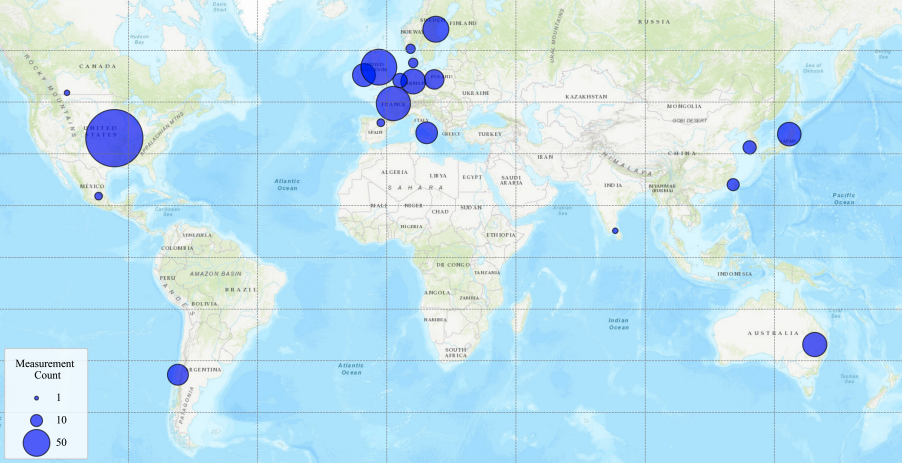
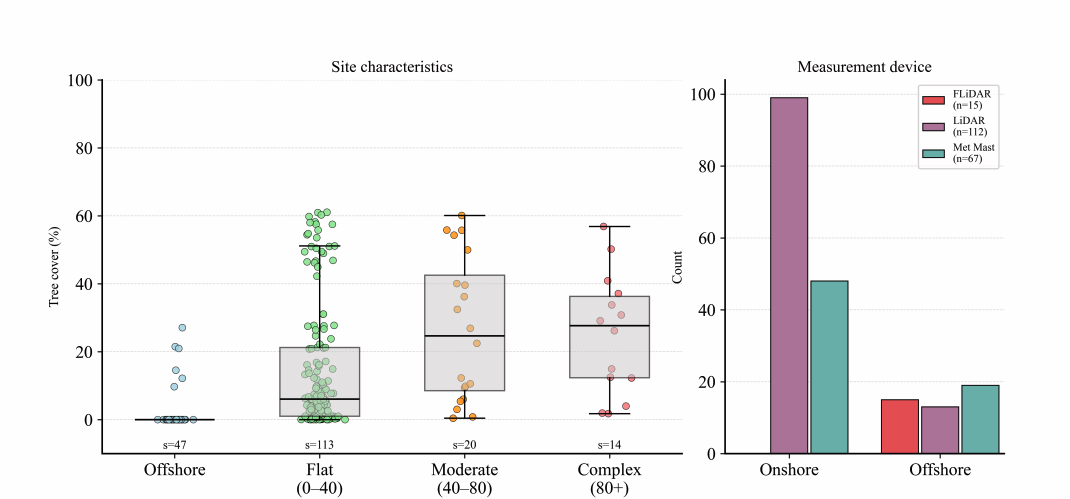
This is RWE’s independent benchmark of Whiffle’s models, peer-reviewed and presented at TORQUE 2026. Across 170 wind farm sites worldwide, RWE compared four model fidelities, ERA5, MERRA-2, Whiffle Meso, and Whiffle Meso-LES, against 194 independent measurements from met masts, LiDARs, and floating LiDARs, each with a minimum of 12 months of data. RWE selected the sites and set the inclusion criteria.
Figure 1: Overview of site characteristics and measurement device
A quick look at the results
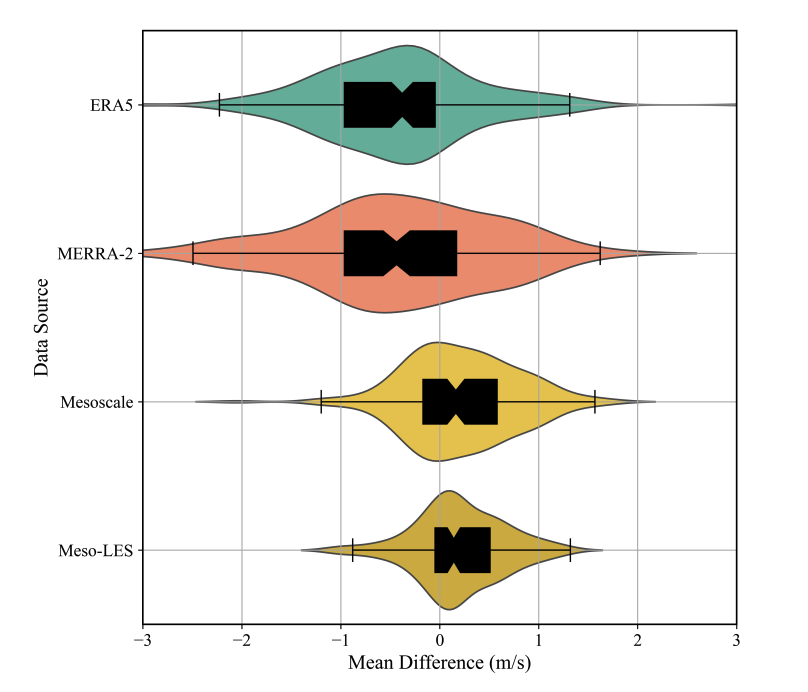
RWE’s benchmark ranked four data sources by mean bias error (MBE) across all 194 measurements.
Whiffle LES earns its place in complex terrain
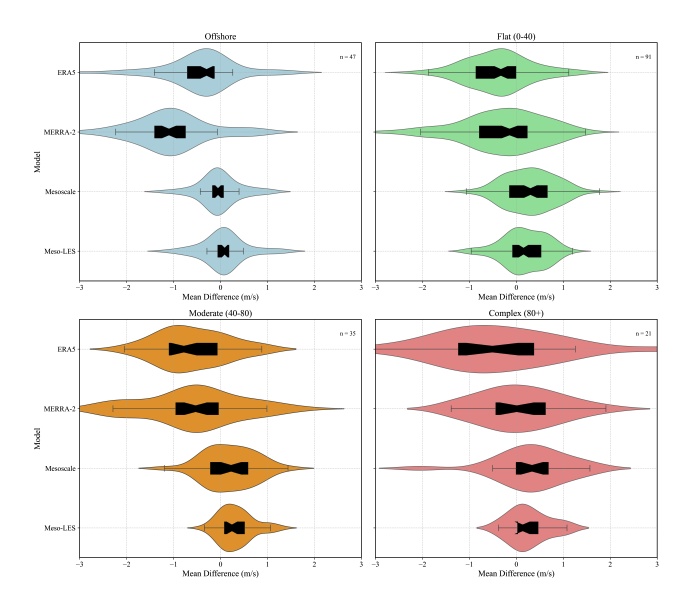
In moderate and complex terrain, additional LES downscaling further reduces bias and narrows the spread where smaller-scale flow effects become increasingly important.
Downscaling from reanalysis to Whiffle Meso delivers the single biggest accuracy jump
Mesoscale alone captures mean wind speed within about 1 m/s at most sites, the largest single accuracy gain of any step in the study.
Whiffle LES: lowest bias, most often
Meso-LES had the smallest absolute mean bias error in 91 of 194 measurements — more often than any other source tested.
Figure 2: Mean difference in wind speed (m/s) by data source, the Mean Difference panel from the paper's Figure 4. Shown for ERA5, MERRA-2, Mesoscale, and Meso-LES; boxplot marks median and interquartile range, across all 170 evaluated sites.
Whiffle LES: Lowest bias, most often, of any source tested
Ranked by smallest absolute MBE across 194 measurements: Meso-LES came out lowest bias in 91 (46.9%), Mesoscale in 63 (32.5%), ERA5 in 40 (20.6%). Fourteen points ahead of our own mesoscale model, twenty-six ahead of reanalysis.
Whiffle LES earns its place where terrain gets complex
In complex terrain, ERA5 and MERRA-2’s bias spans nearly the full range tested. LES stays the tightest of the four sources, resolving the small-scale orographic effects that drive the wind regime there directly from the physics, rather than approximating around them on a coarser grid.
Figure 3: Wind speed mean bias error (MBE) by terrain class: offshore, flat, moderate, and complex onshore. Violin plots show the full distribution per model (ERA5, Mesoscale, Meso-LES); boxplots mark the median and interquartile range.
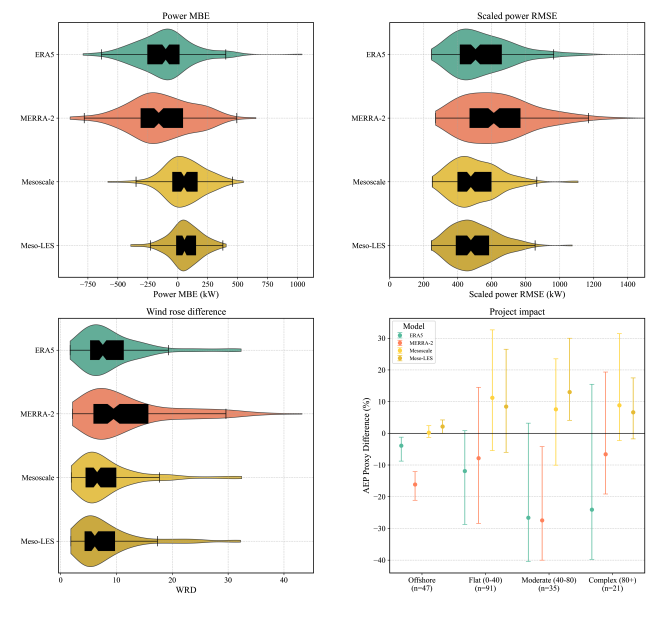
Figure 4: Top left, top right and bottom left show distributions of PMBE, scaled power RMSE, WRD across all sites. Bottom right summarises the median and interquartile range of an AEP proxy (percentage power sum difference relative to the reference) for offshore, flat, moderate, and complex terrain.
Mesoscale is the biggest step, LES is the 'last mile'.
Downscaling from reanalysis to mesoscale delivers the largest accuracy gain in the study. Offshore and across simple terrain, mesoscale already captures much of what matters. In moderate and complex terrain, LES further reduces error by resolving more of the site-specific flow.
From wind-speed error to gross-power impact (AEP proxy)
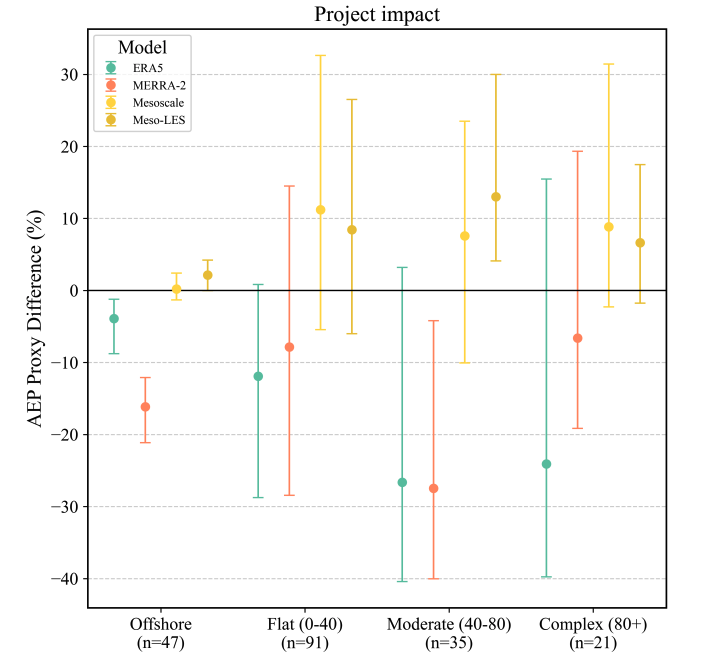
The study also translated wind-speed differences into a gross-power proxy. Offshore, Meso and Meso-LES showed little bias. For onshore projects using modelled data without site calibration, errors remained around ±10%, reinforcing the importance of measurement calibration in project-level assessment.
Figure 5: AEP proxy (percentage power-sum difference vs. reference) by terrain class, offshore, flat, moderate, complex, for ERA5, Mesoscale, and Meso-LES.
What this means for your project
Model accuracy matters when it changes the confidence you can place in an energy estimate.
Persistent wind-speed bias can propagate into predicted energy yield and revenue. Reducing that bias gives you stronger evidence behind project assumptions — particularly at sites where local terrain makes uncertainty harder to constrain.
The right level of modelling still depends on the project. Terrain complexity, available measurements and assessment methodology all determine how much additional fidelity is valuable.